|
 |
 |
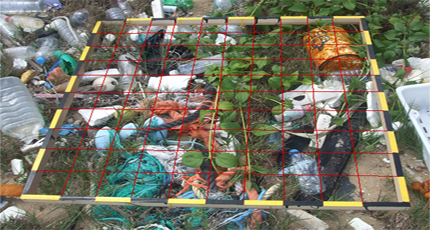
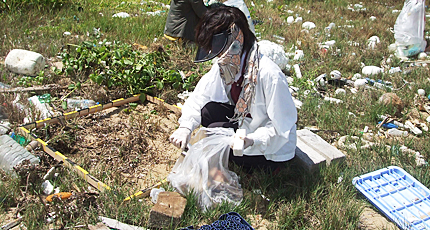
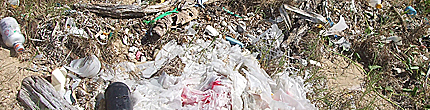
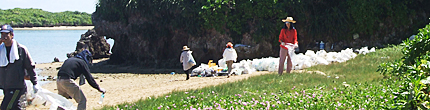
| Marine Debris Survey at a Beach in Miyako Island |
| Date Monitored: |
October 3, 2010 |
Beach Size: |
100-105 meters x 10-12 meters |
| Surrvey Conducted by: |
Dr. Satoshi Oshiro & eight members |
Sampling Unit: |
100 meters x 10 meters |
| Beach Name: |
Karimata in Miyako Island, Okinawa, Japan |
Beach Usage: |
Rural |
| Beach ID (Lati./Long): |
24.893743, 125.281442 (Center of sample unit) |
River/Creek input: |
No |
|
 |
 |
Total Number and Weight of Debris Items Collected from Survey Site
(Sampling Units: 100m x 10 m. Start point: 24.893717, 125.281874 End point: 24.893933, 125.281107) |
| |
Types of Debris |
Quantity |
% |
Weight (kg) |
% |
Country-by-Country |
| |
|
|
|
|
|
J=Japan, C=China, T=Taiwan, K=Korea, U=unknown |
| Fishing Gears: |
|
|
|
|
|
1. |
Fishing net |
inextricable |
|
22.00 |
8.44% |
|
2. |
Fishing lines |
18 |
1.17% |
0.75 |
|
|
3. |
Fishing floats and quills |
152 |
9.90% |
45.20 |
17.34% |
|
4. |
Crab pot and traps |
3 |
0.20% |
21.50 |
8.25% |
|
5. |
Ropes |
inextricable |
|
17.00 |
6.52% |
|
6. |
EPS Fish box or foam-filled fish box |
multiple |
|
34.90 |
13.39% |
|
|
|
|
|
|
|
| Plastic Products* |
|
|
|
|
7. |
6 Pack holders |
|
|
|
|
|
8. |
Plastic bags |
47 |
3.06% |
0.40 |
0.15% |
|
9. |
Caps, lids, pull tabs |
|
|
|
|
|
10. |
Plastic cups, knives, forks, spoons |
|
|
|
|
|
11. |
Food wrappers, sandwich bags |
|
|
|
|
|
12. |
Plastic containers |
|
|
|
|
|
13. |
Straws, stirrers |
|
|
|
|
|
14. |
Beverage bottles |
1248 |
81.30% |
51.00 |
19.56% |
| J |
91 |
C |
670 |
T |
52 |
K |
46 |
U |
389 |
|
15. |
Balloons |
|
|
|
|
|
16. |
Plastic Baskets |
3 |
0.20% |
7.50 |
2.88% |
|
17. |
Plastic pieces |
multiple |
|
25.00 |
9.59% |
|
| |
|
|
|
|
|
| Other Debris: |
|
|
|
|
18. |
Cigarette filters |
|
|
|
|
|
19. |
Cigarette lighters |
|
|
|
|
|
20. |
Tires |
1 |
0.07% |
7.50 |
2.88% |
|
21. |
Light bulbs |
8 |
0.52% |
0.70 |
0.27% |
|
22. |
Rubber pieces |
multiple |
|
5.50 |
2.10% |
|
23. |
Slippers |
17 |
1.10% |
3.00 |
1.15% |
|
24. |
Cable Sleeves |
multiple |
|
4.50 |
1.73% |
|
25. |
Glass bottles |
37 |
2.41% |
15.00 |
5.75% |
|
26. |
Syringes |
1 |
0.07% |
|
|
|
| 27. |
Soda cans |
1 |
|
|
0.00% |
|
| 28. |
Cans |
1 |
|
0.60 |
0.00% |
|
| |
TOTAL |
1535 |
100% |
262.05 |
100% |
| J |
92 |
C |
690 |
T |
52 |
K |
48 |
U |
665 |
|
| |
|
|
|
 |
| Density Survey (Sample Unit: One SQ meters Quadrat Located at 24.893755, 125.281346) |
| |
Types of Debris |
Quantity |
% |
Weight (g) |
% |
|
| a. |
Plastic beverage bottles |
6 |
7.69% |
200 |
2.70% |
|
| b. |
Plastic containers |
1 |
1.28% |
110 |
1.49% |
|
| c. |
Plastic bags |
|
|
|
|
|
| d. |
EPS Fish box or foam-filled fish box |
27 |
34.62% |
140 |
1.90% |
|
| e. |
Fishing lines, fishing gears |
|
|
|
|
|
| f. |
Fishing floats and quills |
5 |
6.41% |
280 |
3.79% |
|
| g. |
Fishing net & ropes |
10 |
12.82% |
5550 |
75.15% |
|
| h. |
Rubber slippers, sandals |
3 |
3.85% |
130 |
1.76% |
|
| i. |
Soda cans |
1 |
1.28% |
30 |
0.41% |
|
| j. |
Plastic pieces |
24 |
30.77% |
270 |
3.66% |
|
| k. |
Rubber pieces |
multiple |
|
65 |
0.88% |
|
| l. |
PP foam pieces |
multiple |
|
20 |
0.27% |
|
| m. |
Cans |
1 |
1.28% |
590 |
7.99% |
|
| |
TOTAL |
78 |
100% |
7385 |
100% |
|
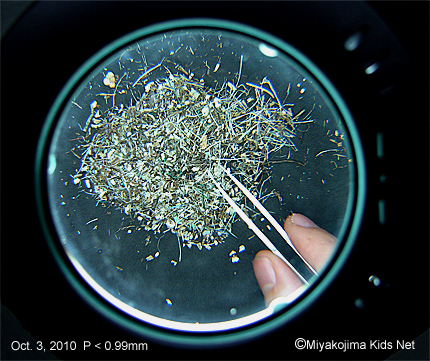
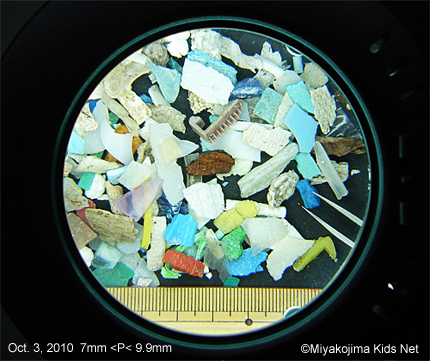
| Micro Debris Survey (One SQ meters Quadrat Located at 24.893755, 125.281346) |
| |
Size break down |
Quantity |
Weight (g) |
% (Qty) |
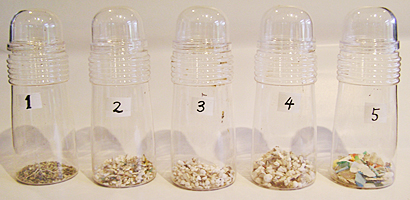 |
| 1. |
P <0.99mm |
665 |
600 |
38% |
| 2. |
1mm < P < 2.9mm |
526 |
5,700 |
30% |
| 3. |
3mm < P < 4.9mm |
262 |
2,100 |
15% |
| 4. |
5mm < P <6.9mm |
203 |
4,300 |
13% |
| 5. |
7mm < P < 9.9mm |
75 |
7,800 |
4% |
| |
TOTAL |
1,731 |
20,500 |
100% |
Data for classification of micro debris and plastic material identification
are
also available. |
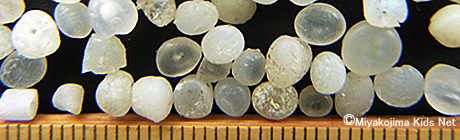
| Identify Nurdles (Pre-Production Plastic Pellets found in the One SQ meters Quadrat Located at 21.893755, 125-281346) |
| Nurdles are one of the largest contributors to marine debris and often called toxic meal for fish and other marine life. |
| |
Type of Nurdle |
Quantity |
Weight(mg) |
% (Qty) |
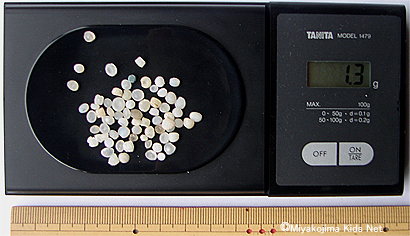 |
| 1. |
Plastic Pellets |
41 |
700 |
55.4% |
| 2. |
Recycled Plastic Pellets |
33 |
600 |
44.6% |
| |
TOTAL |
74 |
1,300 |
100% |
 |
| Methods of Disposal Applied |
| |
Type of Debris |
Method of
Disposal |
Amount
Disposed (kg) |
Name Facility |
Ratio of
Incineration |
Ratio of
Recycle |
| 1. |
Plastic beverage bottles |
Incinerated |
51.00 |
Miyakojima City Municipal
Incineration Facility (MCMIF) |
19.46% |
|
| 2. |
Fishing floats and quills |
Incinerated |
45.20 |
MCMIF |
17.25% |
|
| 3. |
Fishing net |
Incinerated |
22.00 |
MCMIF |
8.40% |
|
| 4. |
Fishing lines |
Incinerated |
0.75 |
MCMIF |
0.29% |
|
| 5. |
EPS Fish box or foam-filled fish box |
Incinerated |
34.90 |
MCMIF |
13.32% |
|
| 6. |
Plastic bags |
Incinerated |
0.40 |
MCMIF |
0.15% |
|
| 7. |
Ropes |
Incinerated |
17.00 |
MCMIF |
6.49% |
|
| 8. |
Plastic baskets |
Incinerated |
7.50 |
MCMIF |
2.86% |
|
| 9. |
Plastic pieces |
Incinerated |
25.00 |
MCMIF |
9.54% |
|
| 10. |
Rubber pieces |
Incinerated |
5.50 |
MCMIF |
2.10% |
|
| 11. |
Tires |
Recycled |
7.50 |
Miyakojima City Municipal Holding
Facility for Recycle (MCMHFR) |
|
2.86% |
| 12. |
Slippers |
Incinerated |
3.00 |
MCMIF |
1.14% |
|
| 13. |
Cable Sleeves |
Incinerated |
4.50 |
MCMIF |
1.72% |
|
| 14. |
Light bulbs |
Incinerated |
0.70 |
MCMIF |
0.27% |
|
| 15. |
Glass bottles |
Recycled |
15.00 |
MCMHFR |
|
5.72% |
| 16. |
Cans |
Recycled |
0.60 |
MCMHFR |
|
0.23% |
| 17. |
Crab pot and traps |
Recycled |
21.50 |
MCMHFR |
|
8.20% |
| 18. |
Syringes |
Incinerated |
0.00 |
MCMIF |
0.00% |
|
| |
TOTAL |
|
262.05 |
|
82.99%
(217.45kg ) |
17.01%
(44.6kg) |
|
|
|
|
 |